AC9M4ST01
Statistics > (1) Gather, (2) Display, (3) Communicate
Australian Curriculum Version 9 Says:
Acquire data for categorical and discrete numerical variables to address a question of interest or purpose using digital tools; represent data using many-to-one pictographs, column graphs and other displays or visualisations; interpret and discuss the information that has been created.
What this means
Collect categorical data (types or categories). Collect numerical data that can be counted (discrete). Display the data. Think and talk about the data.
Tips
- At Year 4 students require explicit instruction about which type of graph is appropriate.
- The graphs need to show
many-to-one data such as a pictograph that shows one image to depict 5 people.

Interactives & Downloadables
Resources & Manipulatives
-
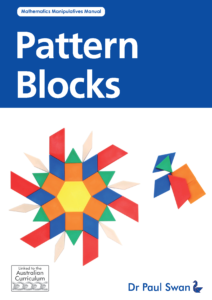
- Select options This product has multiple variants. The options may be chosen on the product page
Pattern Blocks
$22.00 – $119.00 inc. GST
Beyond
Quick Guides (AC9) Purpose
These Quick Curriculum Guides have been designed to take a look at the new Australian Mathematics Curriculum (AC9), explain terminology and provide interpretations.
Year 7+?
Our Quick Guides end at Year 6, but if you look at the bottom of the Year 6 cards you will see that they are linked onwards to Year 7. We recommend you visit the appropriate Curriculum pages on ACARA’s site.
Disclaimer
These documents serve as general advice only and do not take into account your specific needs and conditions. While best care has been taken in compiling these materials, mistakes may exist. Australian Curriculum version 9 materials used under Creative Commons licence from ACARA. Readers should always refer back to the curriculum itself and the state-based curriculum that is relevant for you. These documents copyright of A-Z Type (Dr Paul Swan). Full Books
These Quick Curriculum Guides have been designed to take a look at the Australian Mathematics Curriculum (AC9), explain terminology and provide interpretations.
Narelle and I have used our professional judgement to put forward what is appropriate for students at this year level.
Authors: Dr Paul Swan & Narelle Rice
We would like to also thank Linda Marshall and David Dunstan for comments and assistance.
These documents serve as general advice only and do not take into account your specific needs and conditions. While best care has been taken in compiling these materials, mistakes may exist.
Australian Curriculum version 9 materials used under Creative Commons licence from ACARA. Readers should always refer back to the curriculum itself and the state-based curriculum that is relevant for you.
This document is copyright of A-Z Type (Dr Paul Swan). A copy of this document may be downloaded from www.drpaulswan.com.au.