-

- Select options This product has multiple variants. The options may be chosen on the product page
Teaching Mathematics Through Story Books 3 Years 4-6
$26.00 – $129.00 inc. GST -
- Select options This product has multiple variants. The options may be chosen on the product page
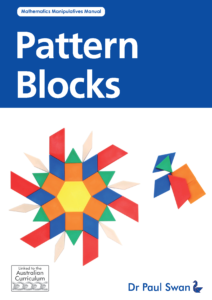
Pattern Blocks
$22.00 – $119.00 inc. GST -
- Select options This product has multiple variants. The options may be chosen on the product page
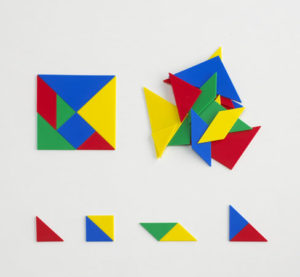
Toying with Tangrams
$19.00 – $129.00 inc. GST -
Plastic Tangrams (4 pack | soft & quiet)
$15.00 inc. GST